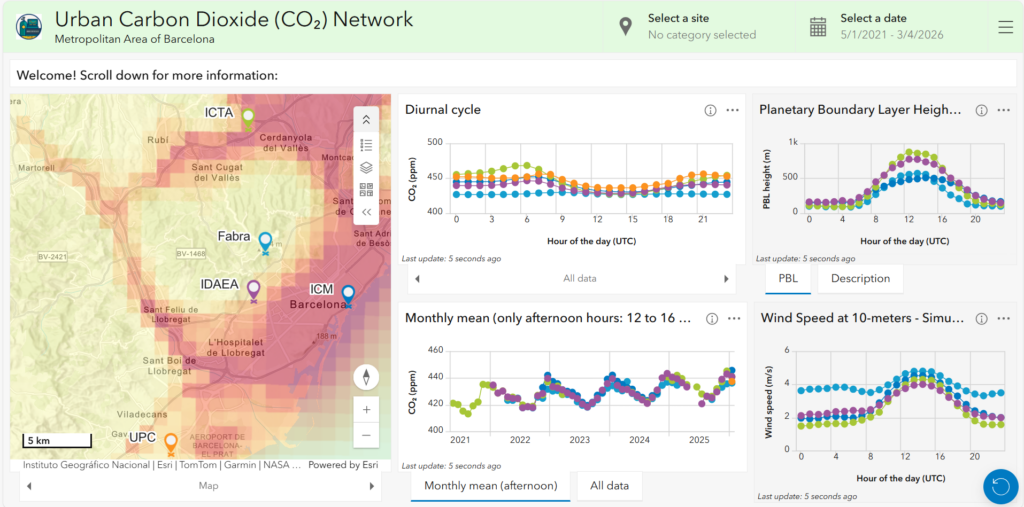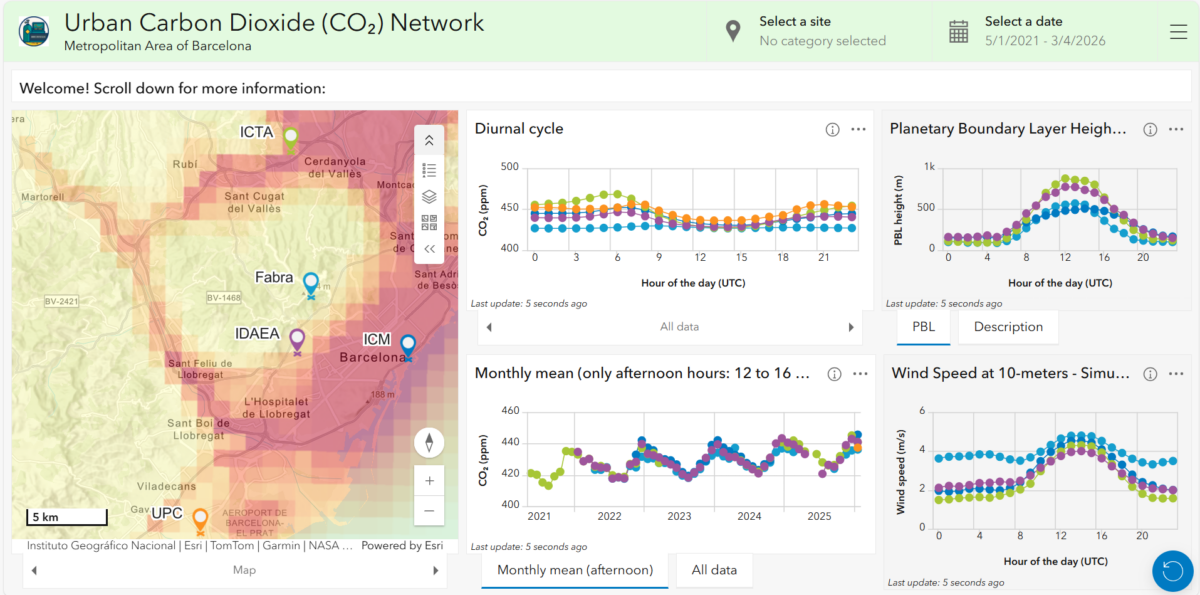
Discover the Urban GHG Monitoring Network Dashboard, a platform providing near real-time (NRT) and historical observations of carbon dioxide (CO₂) across the Metropolitan Area of Barcelona.
📍 Interactive Map
Visualize the geographic distribution of monitoring stations — including IDAEA, ICTA, Fabra, ICM, and UPC — and explore site-specific atmospheric measurements.
📈 Track Temporal Patterns
- Time-series charts with monthly mean concentrations of CO2, highlighting seasonal trends and long-term changes.
- Diurnal cycle plots display average hourly variations, showcasing daily patterns driven by emissions and atmospheric processes.
🌬️ Understand Atmospheric Dynamics
Simulated meteorological data, such as Planetary Boundary Layer (PBL) height and 10-meter wind speed, complement GHG measurements to provide insights into urban atmospheric mixing and transport.
💡 Why It Matters
This integrated dashboard is an essential tool for researchers, policymakers, and urban planners, supporting studies on emission sources, climate mitigation strategies, and urban carbon dynamics in Barcelona.